
Greetings to you on the crypto site. My name is Viktor and today I will share my opinion about #bitcoin, #btc-usdt, using the TradingView service, here Prediction Bitcoin this week, 21-04-2025
Current Bitcoin price forecast for the week of April 21, 2025 from @CryptoViktor_UA. Analysis of market factors, indicators, liquidation map, overview of gold and altcoins, and announcement of a private crypto investors’ club.
Prediction Bitcoin
Bitcoin: Upward Movement Started? Market Overview on 04/21/25
Bitcoin Forecast for the Week (April 21, 2025): Market Analysis & Club Announcement
Hello everyone! Today’s Bitcoin forecast is coming out a bit later than usual on Monday due to events in the stock market. In this video, we look at factors influencing the price, analyze charts on different timeframes, and share the main forecast. Also have an important announcement!
Article Plan:
- Announcement of the Private Club for Crypto Investors
- @CryptoViktor_UA’s Website and Resources: cryptoviktor.com and YouTube Channel
- Fear and Greed Index: Decrease in Fear
- Technical Indicators: Prevalence of Buyers
- Monthly and Quarterly Statistics for Bitcoin and Ethereum
- Heatmap of Liquidation: Analysis of Liquidity Collection
- Crypto Risk Index: Transition to the Yellow Zone
- The “Gold First” Idea: Relevance
- Psychology of Altcoin Investors: Whale Accumulation Phase
- Chart Analysis: Starting with the Hourly Timeframe for Bitcoin
- Analysis of the Bitcoin Daily Chart: Key Red Zone (Lux Algo)
- Analysis of the Bitcoin Weekly Chart: Growth Potential (Stochastic, Volumes)
- Analysis of the Bitcoin Monthly Chart: Overall Trend and Targets (160K)
- Analysis of Bitcoin Dominance, Total Capitalization, and Altcoins
- Influence of Traditional Markets (Gold, Stock Indices): What’s Happening?
- Forecast for the Week: Breakout Above 88K and Movement to 96K
- Analysis of the Hourly Chart: Weekend and Start-of-Week Dynamics
- Call to Action and Discussion
Article Sections:
Announcement of the Private Club for Crypto Investors
Want to announce an important topic: a decision has been made to open a private club for crypto investors. Entry will be through a private message, where you can share about your crypto experience or investment idea. After moderation and provided you are active, you can join a small circle of active investors. This club is not for those just starting to learn crypto investing, but for discussing ideas and strategies. The club will be protected from spammers and will be located in Discord. All information will be available on Saturday.
@CryptoViktor_UA’s Website and Resources: cryptoviktor.com and YouTube Channel
It is always recommended to start your research on the cryptoviktor.com website, the Bitcoin section. There is an opportunity to use various tools for your analysis there. Also, a reminder about the YouTube channel, where daily Bitcoin video forecasts are published and a global analysis is done once a week. In the “Posts” section on the channel, you can find the text version of the forecasts and join discussions on the cryptocurrency forum in Ukrainian.
Fear and Greed Index: Decrease in Fear
The Fear and Greed Index is currently at 34. Remember, quite recently it was in the red zone, and people were very scared? Now fear is gradually disappearing, the indicator is moving towards the neutral zone – this is a good sign for the Bitcoin price.
Technical Indicators: Prevalence of Buyers
Technical indicators show that most people are currently buying Bitcoin. The direction of the arrow confirms this.
Monthly and Quarterly Statistics for Bitcoin and Ethereum
The month has ended, and Bitcoin’s quarterly statistics are already in the positive zone (+5%). Ethereum is still lagging behind but also shows growth this month (+5%). We expect a continuation of the green zones.
Heatmap of Liquidation: Analysis of Liquidity Collection
The heatmap of liquidation is shown daily. It visually demonstrates how liquidity is being collected. Yesterday, many positions of people who expected further decline were liquidated. This shows how important it is to understand approximately where the price might go.
Crypto Risk Index: Transition to the Yellow Zone
Currently, the crypto risk index is 52. Remember, it was at 25? This means that buying for investing now, according to this index’s data, is riskier. There is a transition to the yellow zone.
The “Gold First” Idea: Relevance
We continue to monitor gold, as it is believed that its movement affects Bitcoin. Currently, gold, in my opinion, has reached the target for this cycle and should move into consolidation. Its movement has not stopped yet, possibly because people are seeking refuge for their money against the backdrop of the situation in the US stock market.
Psychology of Altcoin Investors: Whale Accumulation Phase
It is constantly reiterated in the daily videos that there is currently a zone of maximum distrust in altcoins. It is believed that big capital uses this to extract altcoins from us at low prices. People are becoming smarter and holding their assets, making it harder for big capital to acquire the necessary amount of altcoins. This may explain why this phase is lasting so long.
Chart Analysis: Starting with the Hourly Timeframe for Bitcoin
Let’s begin chart analysis with the hourly timeframe for Bitcoin. Saturday and Sunday were quite calm. The SVP HD indicator was used, which shows daily trading volumes. This morning (which was daytime for Asia) the price pulled up from 84 to 87 and continues to rise.
Analysis of the Bitcoin Daily Chart: Key Red Zone (Lux Algo)
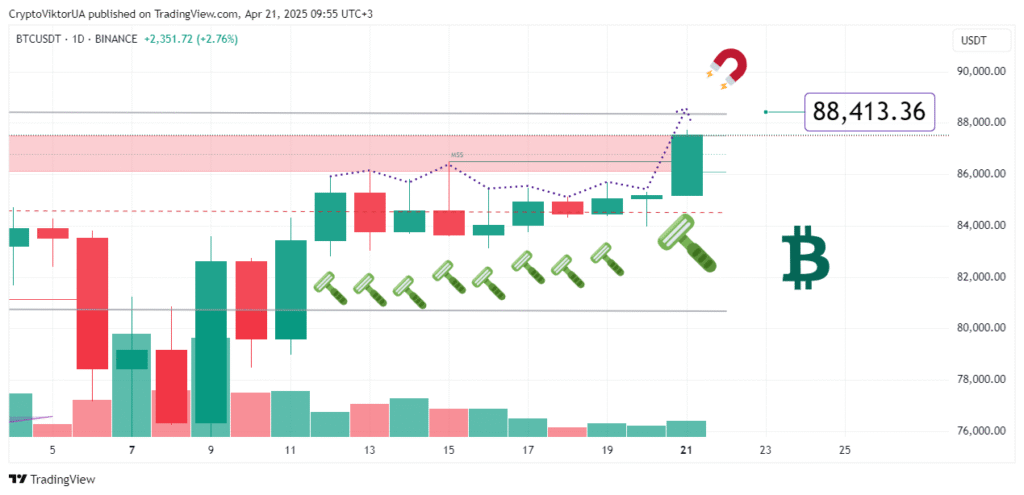
On the daily chart, there is the familiar Lux Algo indicator, about which there is a video. It shows an important red resistance zone. Last week the price tested this zone but could not break through it. Today, as trading began on stock platforms, we see a powerful upward push, breaking through this red zone. This means the path to 95K is opening up.
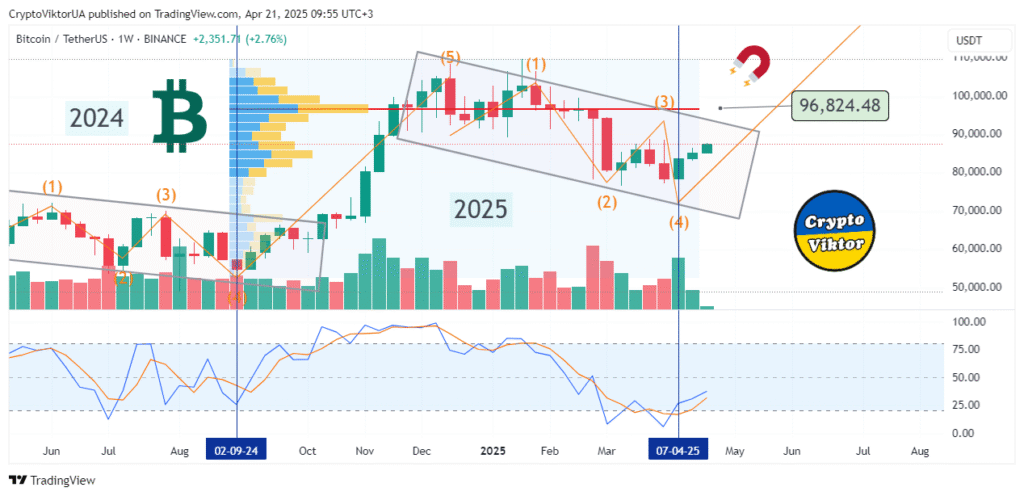
Analysis of the Bitcoin Weekly Chart: Growth Potential (Stochastic, Volumes)
On the weekly chart, everything is within the logic of understanding. The Stochastic indicator is at the bottom, both lines are pointing upwards – the trend is upwards. The growth process has just begun, it’s the third week. The 95-96K zone, which was mentioned earlier, is the zone of maximum trading volumes, according to the horizontal volumes indicator. The price will be drawn towards this zone.
Analysis of the Bitcoin Monthly Chart: Overall Trend and Targets (160K)
On the monthly chart, the overall trend is upward. The greater the volatility of accumulation platforms, the closer to the end of the Bitcoin cycle. This could mean there will be another move to 160K, and essentially, the end of this season. The downward move, when it happens, is expected to be rapid, as in past cycles.
Analysis of Bitcoin Dominance, Total Capitalization, and Altcoins
Bitcoin dominance continues to grow (63.2%). This means that interest in Bitcoin is at its peak for this season. It would be good for Bitcoin if dominance remained above 60% until the 160K peak is reached. Only after that, with decreasing dominance, will altseason begin. The total capitalization of all cryptocurrencies is showing an upward rebound on the stochastic, and has potential for growth. Altcoins have also started to reverse slightly from the stochastic, waiting for growth, but, as seen, they will not go ahead of Bitcoin.
Influence of Traditional Markets (Gold, Stock Indices): What’s Happening?
Brief mention is made of the situation in stock markets, particularly in the US, Europe, and Asia, in the context of how they can influence the crypto market. The current price movement of gold is also analyzed.
Forecast for the Week: Breakout Above 88K and Movement to 96K
The forecast for this week is a breakout from the 88K zone and the start of a move towards 96K. On the daily chart, it is seen that after breaking through the red resistance zone at 88K, the path to 96K opens up. On the hourly chart, an upward rebound is being observed.
Analysis of the Hourly Chart: Weekend and Start-of-Week Dynamics
The price movement on the hourly chart is analyzed throughout the weekend and at the start of the week, noting a calm Saturday and Sunday, followed by an active upward move this morning.
Call to Action and Discussion
For this week, a continuation of growth is seen. Changes in the price will be monitored daily in the videos. If the video was helpful, please like it, write comments, and join the forum. The forum is a place for communication where you can share your thoughts and see the thoughts of others. Make your financial decisions independently and be cautious!
- Прогноз Біткоїн на Тиждень [21 квітня 2025] @CryptoViktor_UA
- 📌 Source: cryptoviktor.com/btc/

