
Greetings to you on the crypto site. My name is Viktor and today I will share my opinion about #bitcoin, #btc-usdt, using the TradingView service, here Bitcoin Forecast for the Week of 01-07-2024
Bitcoin Forecast
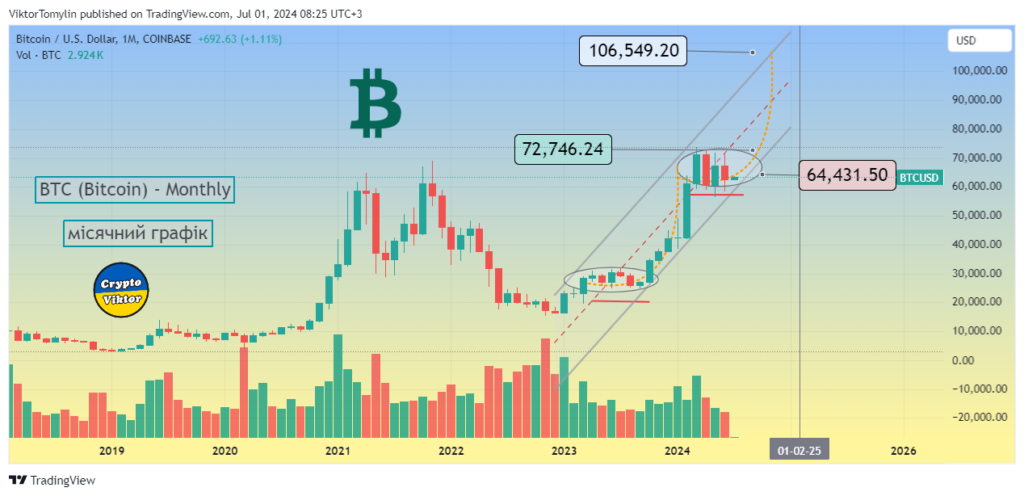
Greetings. My name is Victor, and today we will be conducting a technical analysis and forecast of the bitcoin exchange rate. Let’s start with the monthly timeframe.
Bitcoin monthly chart
On the monthly chart, we can see that July started with a green candle, although bitcoin is still in the range of $57,000 – $72,000. I predict that the rate will remain in this range this month, and that significant growth will begin only in autumn. In October-December, we can expect a strong upward movement that will lead to new historical highs.
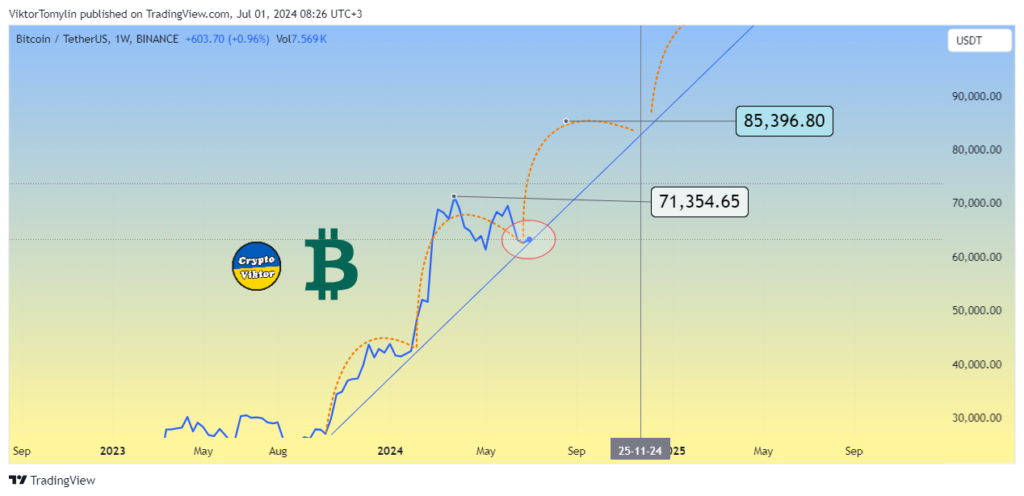
Weekly chart of BTC
The situation is more interesting on the weekly chart. We see an upward trend that began after the first wave of growth. If the second wave also hits this line, it will be a very powerful signal. Currently, the rate is within the range of up to $71,000. If it breaks through this level, we will see a move to $85,000 to $80,000. This may take a few weeks, but the potential for growth remains high.
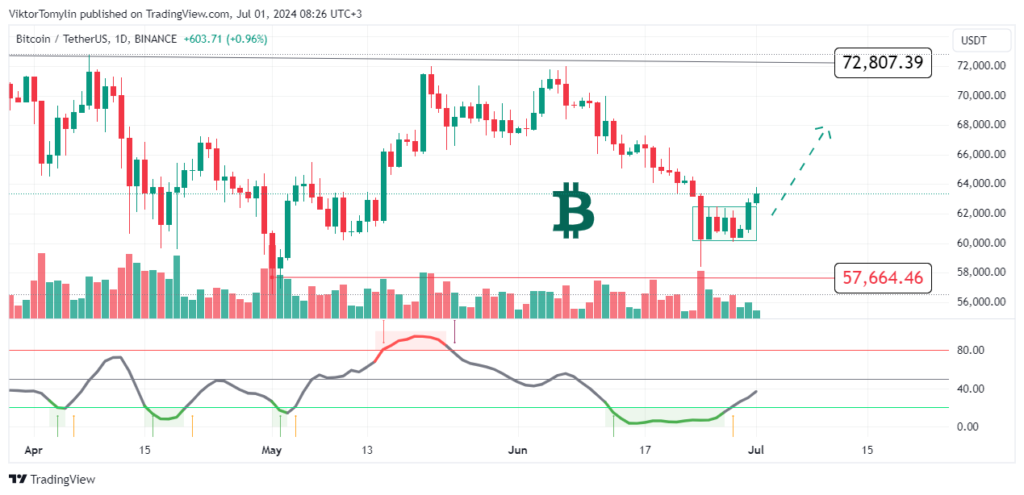
Daily chart of BTC (Bitcoin)
We use several indicators on the daily chart. The divergence indicator shows that the rate has passed the overbought zone and is now heading upwards. The MACD indicator also shows an upward trend. Fibonacci shows that the rate is moving from the red zone to the middle zone. According to the stochastic indicator, the rate is moving from the underbought zone to the overbought zone, which also indicates the possibility of continued growth.
BTC dominance
Bitcoin’s dominance is also an important indicator. It affects the overall state of the cryptocurrency market and can give clues about future movements. Currently, bitcoin’s dominance is at a high level, which indicates stability and potential for further growth. It is important to keep an eye on this indicator, as changes in dominance can affect the entire cryptocurrency market.
Bitcoin
In summary, we can say that bitcoin shows stable growth on different timeframes. The monthly chart indicates the possibility of significant growth in the autumn, the weekly chart confirms the potential for reaching new highs, and the daily chart shows that there are already conditions for continued growth. Bitcoin’s dominance remains high, which is also a positive signal for the market.
I recommend following the news and indicators to make informed investment decisions. Remember that this is not a financial recommendation, but only my personal opinion. I wish you success in crypto trading and investments! Don’t forget to donate to the Armed Forces and support our country in this important time.
*** Translated with www.DeepL.com/Translator (free version) ***

