
Greetings to you on the crypto site. My name is Viktor and today I will share my opinion about #bitcoin, #btc-usdt, using the TradingView service, here Bitcoin forecast, 17-06-2024
Bitcoin forecast
Bitcoin monthly chart
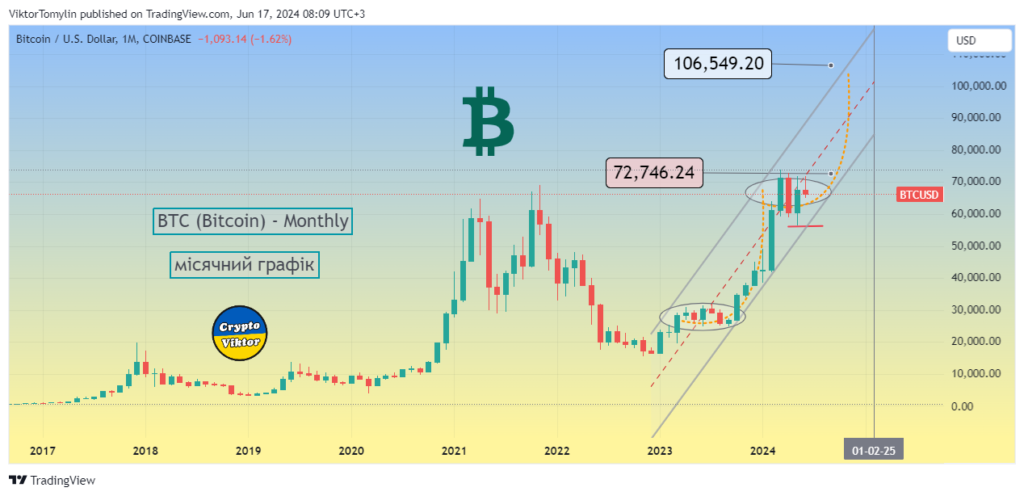
I can see that on the monthly timeframe, Bitcoin has been in an accumulation phase since early 2023. This is reminiscent of the situation before the sharp growth we saw earlier. For example, at one point, the rate rose by 180-185%. Now we see a potential structure for similar growth, and the rate could reach $105-115 thousand. It is expected that a strong upward movement will begin in the autumn, after the current accumulation phase is completed. An important level is $72-73 thousand. When the rate crosses it, we can expect rapid growth.
Weekly chart of BTC
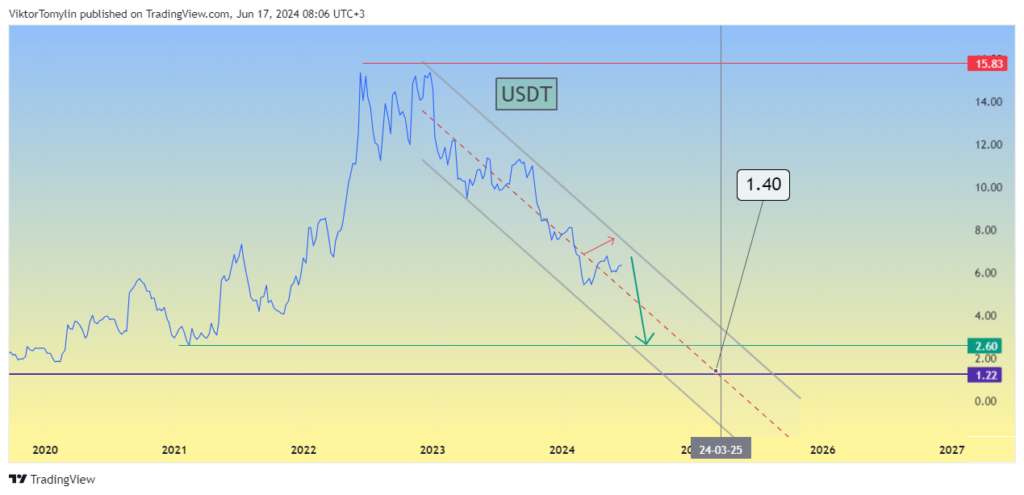
The weekly chart shows that the accumulation phase may end in the summer, and the rate may reach $85,000. Then, perhaps, a new phase will form, which will raise the rate to over $100 thousand. Technical indicators, such as the altcoin season and the USDT indicator, show that a large amount of activity is concentrated in bitcoin rather than altcoins. This is confirmed by the fact that large investors are now more interested in bitcoin, especially in connection with bitcoin ETFs.
Daily chart of BTC (Bitcoin)
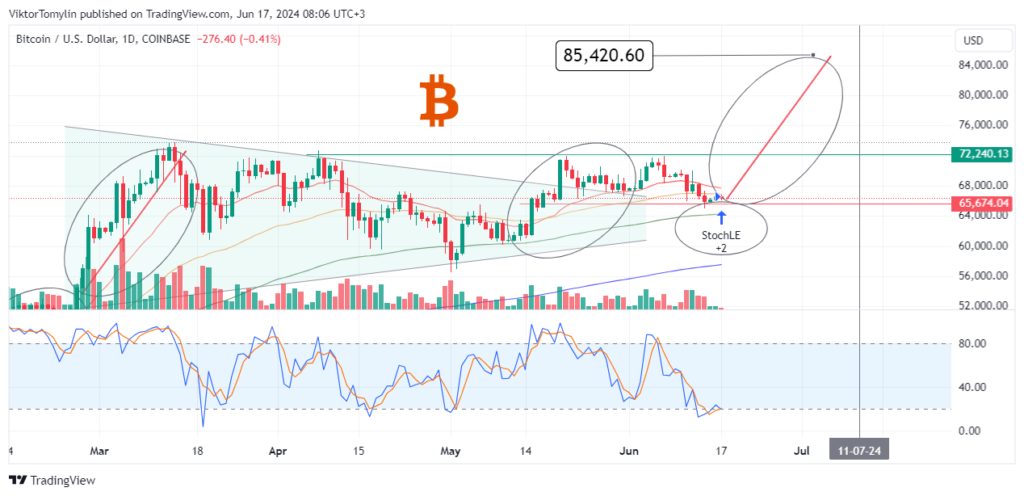
The daily chart shows that bitcoin can move within the $65-72 thousand corridor for some time to come. Indicators such as the CCI show that an underbought zone leads to an increase in the rate. Based on this indicator, we can expect the growth phase to begin in a month or two. Other indicators, such as divergences, show that the rate may remain in the current range or even decline slightly before starting to rise.
Currently, the rate is in the range of $65-72 thousand. A breakout of $72,000 will open the way for a rapid rise to $85,000. On the daily chart, an important indicator is the stochastic, which shows that an underbought zone can lead to an increase in the rate. This is also confirmed by other indicators, such as momentum and MACD, which show that growth could start soon.
$100,000
So, on the monthly chart, we can see an accumulation phase that may end in autumn, after which a sharp rise in the bitcoin rate is expected. On the weekly chart, we see the possibility of growth to $85,000 in the summer, with further growth to $100,000. The daily chart shows that the rate may remain in the range of $65-72 thousand, but a breakout of $72 thousand will open the way to rapid growth to $85 thousand.
Investors should pay attention to technical indicators and follow the news to make informed investment decisions. Do not forget that you make all investment decisions on your own. I wish you successful crypto trading and investment! Write your thoughts in the comments, subscribe to the channel, and like it. Do not forget to donate to the Armed Forces of Ukraine and support our veterans and internally displaced persons. This was Victor, see you in the next video!
*** Translated with www.DeepL.com/Translator (free version) ***

