
Greetings to you on the crypto site. My name is Viktor and today I will share my opinion about #bitcoin, #btc-usdt, using the TradingView service, here Bitcoin: Spring Growth? Market Overview on 03.03.25
Bitcoin: Spring Growth? Market Overview on 03.03.25
Article Plan:
- @CryptoViktor_UA Community: Where to Find Useful Information and Communication
- Fear and Greed Index: Dynamics and Current Values
- Bitcoin Technical Analysis: Indicators and Monthly Statistics
- Liquidation Map Analysis: Short-term and Weekly Overview
- Crypto Risk Indicator and Cardano Situation
- Impact of the “Red-Haired” US President’s Actions on Gold, S&P 500, European, and Bitcoin Markets: Updated Baseline Chart
- Bitcoin and USDT Dominance: Current Situation
- Total Cryptocurrency Market Cap and Altcoins: Year-to-Date Dynamics
- Bitcoin Technical Analysis: Monthly, Weekly, and Daily Charts, Stochastic, MACD, Bars Pattern, MaxD Indicators
- Weekly Forecast and Key Takeaways
Article Sections:
@CryptoViktor_UA Community: Where to Find Useful Information and Communication
For those who missed it, @CryptoViktor_UA recommends watching the new video “Psychology of Crypto Investing” – important thoughts on the maximum Bitcoin price and market behavior. Find up-to-date forecasts, tools, and communication on the website cryptoviktor.com, YouTube channel, and Telegram group. Be careful with private messages, @CryptoViktor_UA never offers capital management in personal messages!
Fear and Greed Index: Dynamics and Current Values
The Fear and Greed Index shows positive dynamics, rising to 39 (Fear phase) compared to 10 yesterday. The technical indicator shows that only 3% of traders are currently selling Bitcoin, 10% are watching, and 13% are actively buying – the market demonstrates an active buying phase.
Bitcoin Technical Analysis: Indicators and Monthly Statistics
Bitcoin monthly statistics remain in the “red zone,” but the current month has started quite powerfully. This dynamic may confirm the author’s opinion that peak Bitcoin prices are still ahead, possibly in a few months.
Liquidation Map Analysis: Short-term and Weekly Overview
Liquidation map analysis on the 12-hour chart shows liquidity collection first from above, then from below. Currently, more liquidity has accumulated above, which may indicate a potential upward movement. The weekly chart also confirms the presence of significant liquidity above in the 95-97 thousand range, making an upward movement more likely.
Crypto Risk Indicator and Cardano Situation
The crypto-risk indicator for most cryptocurrencies, except Cardano, is in the “green zone” (value 29-39), indicating an acceptable level of risk. Cardano stands out against other cryptocurrencies, possibly due to recent statements regarding its integration into US economic policy.
Impact of the “Red-Haired” US President’s Actions on Gold, S&P 500, European, and Bitcoin Markets: Updated Baseline Chart
Analysis of the Baseline chart demonstrates dynamics since the beginning of the year. Gold has grown by 9%, the S&P 500 showed slowed growth (+2%), and European companies are leading with a growth of 12%. Bitcoin is currently in a slight minus (-3% since the beginning of the year). Bitcoin dominance has grown by 6%, USDT dominance – by 15%, total crypto market capitalization has decreased by 11%, and altcoins have fallen by 22% since the beginning of the year. These data indicate a capital flow into gold, European markets, and USDT, against the backdrop of outflow from cryptocurrencies, especially altcoins.
Bitcoin and USDT Dominance: Current Situation
Bitcoin dominance continues to grow, indicating a capital flow into the first cryptocurrency. The growth of USDT dominance indicates profit-taking and investor expectations.
Total Cryptocurrency Market Cap and Altcoins: Year-to-Date Dynamics
The total cryptocurrency market capitalization has decreased, reflecting the outflow of capital. Altcoins have suffered a significant decline (-22% since the beginning of the year), making them the most vulnerable assets in the current market.
Bitcoin Technical Analysis: Monthly, Weekly, and Daily Charts, Stochastic, MACD, Bars Pattern, MaxD Indicators
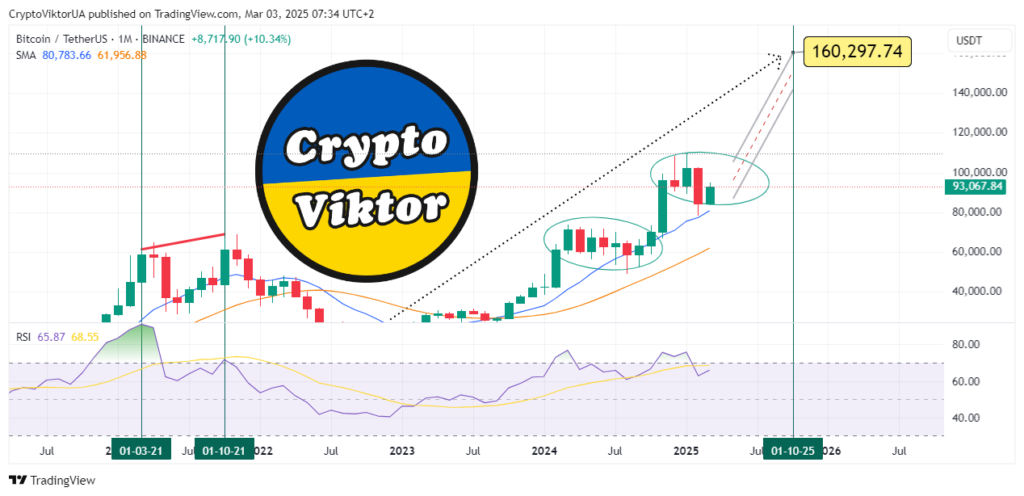
- Monthly Chart: Analysis of the monthly chart confirms previous thoughts about the possible achievement of maximum Bitcoin prices later in the cycle. The Stochastic indicator is in the middle zone, indicating a discharge phase after the previous overbought condition, which may lead to a temporary pullback before further growth.
- Weekly Chart: Two previous Bitcoin growth phases are analyzed, which may be repeated in the current cycle: accumulation phase, growth to 100k, return to 85k, and subsequent powerful upward exit. The Stochastic indicator on the weekly chart is also in the middle zone, confirming the possibility of a pullback before the main growth.
- Daily Chart: The MACD indicator shows an upward arrow, which has already worked successfully before. The Bars Pattern indicator is used to compare current price movements with previous growth phases. The MaxD indicator shows trading volumes for yesterday, highlighting activity zones in the 95.7 range.
Weekly Forecast and Key Takeaways
The weekly forecast from @CryptoViktor_UA – a return of the Bitcoin price to the maximum activity zone of $96,000 is expected, with a further target of $104,000. To consolidate the upward movement, it is important to overcome the $96,000 level. The general sentiment is an expectation of spring Bitcoin growth.
Summary:
The cryptocurrency market remains dynamic, but the analysis of indicators and trading volumes indicates the potential for Bitcoin growth this week. It is important to remember that this is only the author’s personal forecast, and your own research (DYOR) is necessary. Follow daily video reviews and participate in polls from @CryptoViktor_UA for a deeper understanding of market sentiment!
- Прогноз Біткоїн на Тиждень, 03-03-2025 (моє відео українською в YouTube).
- 📌 Source: cryptoviktor.com/btc/

