
Greetings to you on the crypto site. My name is Viktor and today I will share my opinion about #bitcoin, #btc-usdt, using the TradingView service, here Prediction Bitcoin this week, 17-03-2025
Happy Monday everyone! It’s time for my latest Bitcoin overview. What do I see happening this week? I’ll be looking at the main factors influencing the price, breaking down the charts, and sharing my forecasts with you. Plus, I’ll be touching on a sensitive political topic today.
Prediction Bitcoin
My up-to-date Bitcoin price forecast for the week starting March 17, 2025. I’ll be sharing my analysis of market factors, technical indicators, the liquidation map, and overall sentiment. Plus, my thoughts on the current situation, including the political context.
Article Plan:
- My @CryptoViktor_UA Community: a look at my website, useful sections, and my new videos (Solana, Litecoin)
- The Fear and Greed Index: what the current market sentiment is telling us
- Bitcoin Technical Indicators: a look at the neutral zone and monthly stats
- Liquidation Map: my analysis of where the price might be heading
- Crypto Risk Index: my assessment of the current risk level
- Gold, S&P 500, European Indices, and Bitcoin: my take on the RCI indicators and overbought zones
- Bitcoin Dominance and Total Crypto Market Cap: my view on the current trends
- Altseason Indicator: am I seeing a potential reversal?
- Bitcoin Price Manipulations: my analysis of the 2021-2022 cycles
- Bitcoin Technical Analysis: my breakdown of the monthly, weekly, daily, and hourly charts, using MaxD, RSI Divergence, and Stochastic indicators
- My Weekly Forecast: will we see continued growth or a correction to 73K?
- Bitcoin Hourly Chart: my forecast for the end of the European trading session
Article Sections:
My @CryptoViktor_UA Community: a look at my website, useful sections, and my new videos (Solana, Litecoin)
I want to start by reminding you about my website, cryptoviktor.com, where I collect a lot of useful information. I especially want to point out my two new videos on altcoins: Solana and Litecoin. I also show how I use Gemini AI chat from Google for in-depth analysis of crypto assets, and I compare it to what other services can do. Don’t forget to check out the playlists on my @CryptoViktor_UA YouTube channel for my weekly Bitcoin forecasts and daily updates. A quick reminder: please be cautious of private messages! I never offer capital management in personal messages – those are scammers!
The Fear and Greed Index: what the current market sentiment is telling us
The Fear and Greed Index is currently at 22, which puts us in the “red zone,” indicating that fear is dominating among investors when it comes to buying Bitcoin.
Bitcoin Technical Indicators: a look at the neutral zone and monthly stats
My technical indicator is showing a neutral zone right now, which tells me there’s still a lot of uncertainty in the market – roughly half of the traders are buying, and the other half are selling. Looking at the monthly stats, we’re still slightly in the red (1%), but I’m hoping to see that turn positive by the end of the month.
Liquidation Map: my analysis of where the price might be heading
I want to explain how I use the liquidation map, which you can find linked in my Telegram, YouTube, or Discord channels. Analyzing where liquidity is building up above and below the current price can give us clues about the likely direction, although it’s never a sure thing. Right now, the map is pointing downwards, which suggests we might see a dip to collect that liquidity before any further upward movement.
Crypto Risk Index: my assessment of the current risk level
The crypto risk index is sitting at 30, which means it’s still a good time to buy most cryptocurrencies, with the exception of Cardano, which has moved into the “orange zone” after its recent significant growth.
Gold, S&P 500, European Indices, and Bitcoin: my take on the RCI indicators and overbought zones
Looking at the Gold charts, the RCI indicator is already forming a second peak in the overbought zone on the monthly timeframe, which could signal that its growth is nearing an end. On the weekly chart, the overbought zone isn’t as strong, but it’s still there. The S&P 500 index is also showing signs of unwinding after reaching its overbought zone. European indices, on the other hand, still seem to have some room to grow. As for Bitcoin, we’re seeing a slowdown in the decline this month, and I’m anticipating potential growth.
Bitcoin Dominance and Total Crypto Market Cap: my view on the current trends
Bitcoin dominance, according to the RSI indicator, still has the potential to rise to around 62%. The total crypto market capitalization saw a significant drop last month, but I’m expecting to see it turn green this month.
Altseason Indicator: am I seeing a potential reversal?
The altseason indicator, based on the RSI, looks like it might be starting to reverse, although it’s not confirmed yet. I don’t anticipate a significant further drop in altcoins, as they’re already at pretty low levels. We’re definitely in a phase of distrust towards altcoins right now, but I suspect whales might be taking advantage of these low prices to buy up more. I still think a full-blown altseason is likely further out, possibly in the fall.
Bitcoin Price Manipulations: my analysis of the 2021-2022 cycles
I want to take a look back at the Bitcoin growth and fall cycles of 2021-2022. I’ve been paying attention to the price manipulations that happened after we hit those peak values. I’ve been looking at how the price behaved in relation to the Fibonacci zones, and I’m comparing the current situation to those previous cycles. I think we could see similar scenarios play out again.
Bitcoin Technical Analysis: my breakdown of the monthly, weekly, daily, and hourly charts, using MaxD, RSI Divergence, and Stochastic indicators
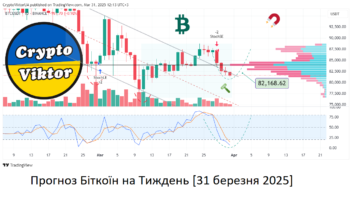
On the weekly chart, the MaxD indicator is showing a BUY signal, just like it did before the previous upward move. The RSI Divergence indicator is also signaling a potential move into the green zone, which is similar to what we saw in past bull cycles. Looking at the daily chart, I’m considering a couple of possible scenarios: continued growth towards the maximum activity zone around 95K, or another downward impulse to 73K before a strong upward reversal.
My Weekly Forecast: will we see continued growth or a correction to 73K?
I don’t have a definitive forecast for this week. I see a 60-70% probability of continued growth towards 95K, but I’m also allowing for a 30-40% chance of a correction down to 73K, followed by an upward reversal. The way the price behaves around the 86K level will be key.
Bitcoin Hourly Chart: my forecast for the end of the European trading session
On the hourly chart, I’m running a poll with the community about where we think the Bitcoin price will be at the end of the European trading session (3:00 PM Kyiv time).
Summary:
The cryptocurrency market is still in a state of uncertainty. I’m looking at a few different possibilities for how things might play out this week, from Bitcoin continuing its upward trend to a potential correction. Keeping an eye on the technical indicators and overall market sentiment will be crucial. Remember, it’s important to do your own research (DYOR), and I encourage you to share your thoughts in the comments below.
- Прогноз Біткоїн на Тиждень [17 березня 2025] @CryptoViktor_UA (моє нове відео)
- 📌 Source: cryptoviktor.com/btc/
