
Greetings to you on the crypto site. My name is Viktor and today I will share my opinion about #bitcoin, #btc-usdt, using the TradingView service, here Prediction Bitcoin this week, 24-03-2025
Greetings everyone on this Monday! As always, I’ve prepared a fresh analysis for you on Bitcoin. What key moments, in my opinion, will define this week? We will carefully examine the factors capable of influencing the price, study the charts, and, of course, I will share my current expectations. And today, we will touch upon a sensitive political topic.
Prediction Bitcoin
Bitcoin: Week of Decisions? My Market Analysis for 03/24/25
My Fresh Bitcoin Forecast for March 24, 2025: Updated Market Overview
My current Bitcoin price forecast for the week starting March 24, 2025. In this issue, I will present my analysis of the market conditions, technical indicators, liquidation data, and the general sentiment of market participants.
Article Plan:
- My @CryptoViktor_UA Community: overview of my website, useful sections, and the latest video materials (Ethereum, XRP, Cardano, Solana)
- Fear and Greed Index: what is the current investor sentiment?
- Bitcoin Technical Indicators: dominance of buyers, positive monthly statistics
- Liquidation Map: analysis of probable price targets
- Crypto Risk Index: transition to the yellow zone, the situation with Cardano
- The relevance of the “gold first, then bitcoin” strategy
- Bitcoin Dominance and the psychological state of altcoin holders
- My thoughts on the potential growth of Bitcoin to the 160K level
- Cryptocurrency news: the focus is on the USA
- Review of my new videos: analysis of the Ethereum flow scheme and investment strategy
- Chart analysis: gold, S&P 500, European stock indices, and Bitcoin
- Bitcoin Dominance and total crypto market capitalization: current indicators
- Altseason Indicator: no changes on the horizon yet
- Bitcoin Technical Analysis on monthly, weekly, and daily timeframes: signals for an upward movement
- My forecast for the upcoming week: consolidation above 106K and movement towards 120K and 160K?
- Analysis of the Bitcoin hourly chart: current dynamics and my expectations
Article Sections:
My @CryptoViktor_UA Community: overview of my website, useful sections, and the latest video materials (Ethereum, XRP, Cardano, Solana)
I will begin my review today by reminding you about my website, cryptoviktor.com, where a wealth of useful information is gathered for you. I want to especially highlight the “Invest Strategy” section, where I accumulate interesting data. Following your numerous requests in the comments, I have added an analysis of XRP, and there are already reviews available for Cardano and Solana, based on artificial intelligence analytics from Google.
Don’t miss my latest videos on the YouTube channel, where I provide a detailed breakdown of the Ethereum flow scheme using the capabilities of Gemini chat and share my investment strategy. I want to remind you that my videos may not always be straightforward for beginners, so if you have any questions, I recommend starting with studying the basic information presented on my website.
Fear and Greed Index: what is the current investor sentiment?
The current value of the Fear and Greed Index is 31, which is higher than the previous indicator and suggests a gradual weakening of pessimism in the market. We are observing a transition from the red zone to the orange zone.
Bitcoin Technical Indicators: dominance of buyers, positive monthly statistics
The analysis of technical indicators shows a clear dominance of buyers in the Bitcoin market at the moment, with purchase volumes exceeding sales volumes fivefold. The monthly statistics are also encouraging: for the third consecutive month, we are seeing positive dynamics, and the current increase is around 3%. Given that there is still a whole week until the end of the month, I expect to see even more impressive results here.
Liquidation Map: analysis of probable price targets
The Liquidation Map continues to be a popular tool among our community members, and I regularly showcase it in my short daily Bitcoin video forecasts. There isn’t much more to add here – you yourself know its operating principle perfectly well. For those who are not yet familiar with this tool, there is a detailed explanatory video on my channel. The map helps us navigate potential price movements by tracking clusters of liquidations.
Crypto Risk Index: transition to the yellow zone, the situation with Cardano
The value of the Crypto Risk Index has increased to 45-42. Let me remind you that in the previous review it was at the level of 30. We are gradually moving into the yellow zone. Cardano has been in this zone for some time now, which, according to this index, indicates an increased risk when buying it. As for the remaining cryptocurrencies, most of them are still available for purchase, although some are already showing a tendency to move into more risky areas.
The relevance of the “gold first, then bitcoin” strategy
The strategy suggesting the outperforming growth of gold relative to Bitcoin remains in effect. We will return to the chart analysis, and those who have not yet fully understood this concept can refer to my two previous videos, where I explain my point of view on this matter in detail.
Bitcoin Dominance and the psychological state of altcoin holders
Let’s pay attention to the Bitcoin dominance indicator. We should not forget about the psychological aspect, especially now that an important psychological moment has arrived for investors holding altcoins. Analyze the current state of affairs and think about what your personal expectations are. My general hypothesis regarding the potential growth of Bitcoin to approximately 160K remains unchanged, although, of course, these are just my assumptions. I have two video clips where I explain my expectations on this matter in detail.
My thoughts on the potential growth of Bitcoin to the 160K level
I want to emphasize once again that my reasoning is not the ultimate truth. I analyze a large amount of information from various sources within the crypto community and interpret it in my video reviews. Thus, my releases represent rather a comprehensive vision of the situation, based on the opinions of various market participants.
Cryptocurrency news: the focus is on the USA
You can follow the news background independently; you can see perfectly well how dynamically the information landscape is changing. At the moment, the main news comes from the United States – everyone is closely watching the actions and statements of American regulators and politicians. In this regard, in my reviews, I primarily focus on technical analysis.
Review of my new videos: analysis of the Ethereum flow scheme and investment strategy
I would like to draw the attention of those who missed it to my two latest videos that have appeared on the main page of my channel: these are a detailed analysis of the Ethereum flow scheme using the capabilities of Gemini chat from Google and my personal explanation of this scheme. This content may not always be clear to beginners, so if you have any questions, I recommend starting with studying the basic materials presented on my website.
My videos are aimed at viewers with a certain level of knowledge in the field of cryptocurrencies. I also advise you to familiarize yourself with the “Invest Strategy” section on my website, where valuable information that I use in my work is collected.
Chart analysis: gold, S&P 500, European stock indices, and Bitcoin
Let’s move on to the chart analysis. On the monthly gold chart, in my opinion, a figure resembling a divergence may form. This is a very strong signal, and if it is confirmed, we may see a significant correction in the price of gold downwards. A similar picture can also be seen on the weekly chart, which could trigger a significant drop in the price of gold.
By the way, the indicator has already begun to show a reversal, and if this trend continues, the formation of the indicated figure is quite likely. As we know from history, usually after gold reverses and starts to decline, after some time we can observe peak prices for Bitcoin. Therefore, we are closely monitoring the dynamics of gold. As for the stock market, as I have already noted, a correction phase has been brewing, and it has already begun.
The RSI indicator points to a downward movement. In Europe, the slowdown in the growth of the stock market will probably begin somewhat later than in the USA. As for Bitcoin, in my opinion, it has completed the formation of the lower half-phase, and we can expect a further continuation of the upward movement. My target mark is still in the region of 160K plus or minus 10,000.
Bitcoin Dominance and total crypto market capitalization: current indicators
The Bitcoin dominance indicator stands at 61%, which indicates the continued high interest of investors and traders specifically in the first cryptocurrency. Altcoins are not yet generating much excitement. The total capitalization of the entire cryptocurrency market is currently $2.7 trillion, and this month is already showing positive dynamics, so I expect further growth.
Altseason Indicator: no changes on the horizon yet
The RSI altseason indicator still retains the potential for growth, and after the current reversal, another wave of growth is quite possible. The total capitalization of altcoins excluding the top 10 shows that many of them are near zero or even negative values, so it is still too early to talk about the arrival of altseason.
Bitcoin Technical Analysis on monthly, weekly, and daily timeframes: signals for an upward movement
On the monthly Bitcoin timeframe, I would highlight the rebound, and the green candle of the current month confirms this. I expect further movement towards the maximum price marks of this season. A very interesting picture is observed on the weekly chart: we have already compared the current situation with the summer of last year, when after the reversal phase, the MaxD indicator gave a BUY signal, followed by significant growth.
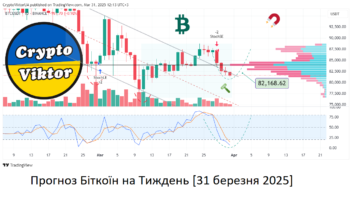
I believe that this process has already been launched, and we are seeing the third consecutive green week. On the daily chart, the price has exited the downward formation, and if it can consolidate here this week, we will see a move into the maximum activity zone at the 96K level.
My forecast for the upcoming week: consolidation above 106K and movement towards 120K and 160K?
My forecast for this week is an exit from the current range and a continuation of the upward movement towards the 89K and further to the 95-96K levels. Judging by the current price dynamics, this scenario is becoming increasingly likely.
Analysis of the Bitcoin hourly chart: current dynamics and my expectations
On the hourly chart, we are actively participating in forecasting with you, conducting regular polls. We are all interested in where the price will go today. We are looking at the yellow vertical lines indicating 3:00 PM Kyiv time (the end of trading in Europe) and making our assumptions about the price movement by that time.
Summary:
I expect further growth of Bitcoin, and we will continue to closely monitor the development of events in my daily three-minute video reviews. Conduct your own research, and if this video was helpful to you, don’t forget to like it and share it with your friends. The goal of my channel and website is to help people make independent financial decisions.
Stop trusting your funds to dubious projects. Conduct your own research and treat your earned money with respect. Continue to learn and develop in this area – that’s why I run this channel and fill my website with information.
- Моє відео: Біткоїн — Прогноз на Тиждень, 24-03-2025
- 📌 Source: cryptoviktor.com/btc/
