
Greetings to you on the crypto site. My name is Viktor and today I will share my opinion about #bitcoin, #btc-usdt, using the TradingView service, here Prediction Bitcoin this week, 10-03-2025
Prediction Bitcoin
New week, new Bitcoin overview from @CryptoViktor_UA! Will we see a market reversal? Examining influencing factors, indicators, community sentiment. Analyzing charts and sharing thoughts – all in our fresh piece!
Article Plan:
- @CryptoViktor_UA Community: Overview of the website and useful sections (Bitcoin, Altseason, Gemini AI)
- Fear and Greed Index: Current values and dynamics
- Bitcoin Technical Indicators: Market sentiment analysis
- Bitcoin Monthly Statistics: Comparison with previous cycles
- Liquidation Map: Analysis of different timeframes
- Crypto Risk Index: Current situation assessment
- Analysis of Gold, S&P 500, European Indices, and Bitcoin: Baseline charts, RCI indicators
- Bitcoin and Total Crypto Market Cap Dominance: Current trends
- Bitcoin Technical Analysis: Monthly, Weekly, Daily, and Hourly charts, RCI, Stochastic, Moving Averages, MaxD, CCI Indicators
- Weekly Forecast and Author’s Personal Thoughts on the political situation and its market impact
Article Sections:
@CryptoViktor_UA Community: Overview of the website and useful sections (Bitcoin, Altseason, Gemini AI)
@CryptoViktor_UA invites you to visit the updated website cryptoviktor.com. Special attention is advised to the “Altseason” section, featuring altcoin analysis using Gemini AI from Google. The video demonstrates how to use Gemini for in-depth crypto market analysis, comparing its capabilities to ChatGPT. Playlists with weekly Bitcoin reviews and daily 3-minute updates, as well as fresh videos on altcoins, including Ethereum and the general altseason, are available on the @CryptoViktor_UA YouTube channel. Be cautious of private messages, @CryptoViktor_UA never offers capital management in personal messages!
Fear and Greed Index: Current values and dynamics
The Fear and Greed Index is at 17 – “Fear” prevails in the market. Technical indicators confirm that most traders are currently selling.
Bitcoin Technical Indicators: Market sentiment analysis
The technical indicator from @CryptoViktor_UA shows that most traders are currently selling Bitcoin, reflecting overall market caution.
Bitcoin Monthly Statistics: Comparison with previous cycles
Bitcoin monthly statistics remain “red,” unlike the 2021 bull market when the first three months were “green.” The current situation is different, and it’s important to analyze the factors influencing the market to prepare for future changes.
Liquidation Map: Analysis of different timeframes
The liquidation map on the 12-hour timeframe shows interesting statistics that everyone can explore independently, using various timeframes, including annual data. Liquidation map analysis can be a useful tool for understanding market dynamics.
Crypto Risk Index: Current situation assessment
The crypto risk index is in the “green zone” (30-32), indicating an acceptable level of risk for most cryptocurrencies, except Cardano, which is in the “orange zone.” This may indicate buying opportunities, which, according to the author, is what big capital is doing.
Analysis of Gold, S&P 500, European Indices, and Bitcoin: Baseline charts, RCI indicators
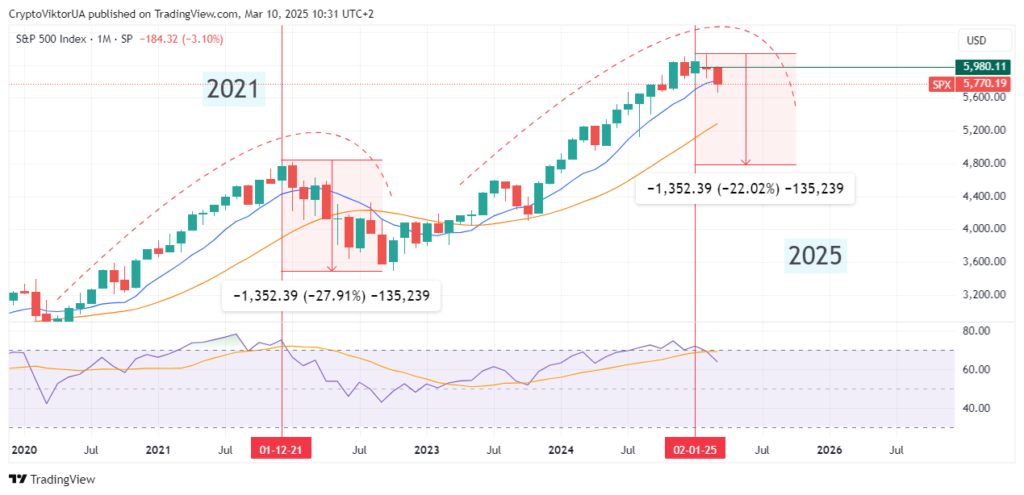
Analysis of Baseline charts and the RCI indicator for Gold, S&P 500, European indices, and Bitcoin reveals potential reversals in traditional markets. A strong divergence is forming on the weekly Gold chart, which may indicate the beginning of a downward movement. The S&P 500 also shows signs of overheating and a possible downward reversal, similar to the 2021 situation. European indices are still maintaining an upward trend. Bitcoin, unlike in 2021, does not show signs of overbought conditions according to the RCI indicator, and, in the author’s opinion, its maximum prices are still ahead.
Bitcoin and Total Crypto Market Cap Dominance: Current trends
Bitcoin dominance remains at 61%, which, in the author’s opinion, is too high for a full-fledged altseason. Total cryptocurrency market capitalization shows a decrease of 22% since the beginning of the year, but, as with Bitcoin, the RCI indicator does not show extreme values, allowing hope for further market growth. Altcoins have experienced a significant decline, but may have already reached their minimum values, and a reversal is not far off.
Bitcoin Technical Analysis: Monthly, Weekly, Daily, and Hourly charts, RCI, Stochastic, Moving Averages, MaxD, CCI Indicators
- Monthly Chart: For strong Bitcoin growth, according to the RCI indicator, pronounced consolidation is needed. The current consolidation phase may last through spring and summer, after which a powerful upward breakout is expected.
- Weekly Chart: The Stochastic indicator on the weekly chart shows a similar structure to last summer, when after a decline phase and reaching low indicator values, a reversal and the next upward wave began. The current green candle may be the beginning of a similar reversal.
- Daily Chart: The daily chart according to the RCI indicator shows a reversal from the “red zone” to the “green zone,” which is a buy signal. The Daily indicator is giving a Buy signal.
- Hourly Chart: On the hourly chart, the RCI indicator entered the “red zone” yesterday, which is a rare occurrence. After yesterday’s decline, a pullback and accumulation are observed, which may indicate the compression of a “spring” for a further reversal.
Weekly Forecast and Author’s Personal Thoughts on the political situation and its market impact
@CryptoViktor_UA expects a reversal and the start of Bitcoin growth this week. Indicators on different timeframes signal the possibility of an upward movement. The author also suggests that a decline in the S&P 500 index could trigger a capital перелив (overflow/flow) into cryptocurrencies. In personal thoughts, the author touches upon the political situation, hinting at “not entirely intelligent things” and the lack of economists in the “red-haired” US president’s team, which may affect markets.
Summary:
The cryptocurrency market analysis for March 10, 2025 from @CryptoViktor_UA indicates a potential reversal and the beginning of an upward Bitcoin movement this week. Indicators and charts of various timeframes provide buy signals. It is important to consider the possible impact of political and economic factors on the market. It is recommended to follow daily video reviews from @CryptoViktor_UA and share your thoughts in the comments. Remember, this is the author’s personal opinion, not financial advice. DYOR!
- Прогноз Біткоїн на Тиждень [10 березня 2025] @CryptoViktor_UA (моє нове відео)
- 📌 Source: cryptoviktor.com/btc/

