Welcome to the crypto site. My name is Victor, and today: Entry to the Crypto, buy Token, 02-07-2024. Join the discussion on the CryptoViktor
Entry to the Crypto, buy Token
Greetings! My name is Victor, and today we will look at technical analysis and forecasts of cryptocurrencies. I would like to remind you that this is not a financial recommendation, but my personal opinions and analysis. So, let’s get started.
Fundamental analysis and news
In this video, we will focus on altcoins. To get a better understanding of the overall market, we will also look at bitcoin and its impact on altcoins. I recommend that newcomers familiarise themselves with general information about altcoins and the altcoin season by checking out my previous videos and articles on the site.
Monthly chart of altcoins
One of the altcoin indicators I use is from the Blockchain Center service, where they take the 50 most popular altcoins and create a visual indicator over 90 days. At the moment, this indicator shows that altcoins are at the very bottom, at 23, which is below the average zone. It is still the bitcoin season, so it is too early to expect a significant increase in altcoins. However, it is worth noting that the indicator was even lower, reaching 16 points this year.

Weekly chart of altcoins
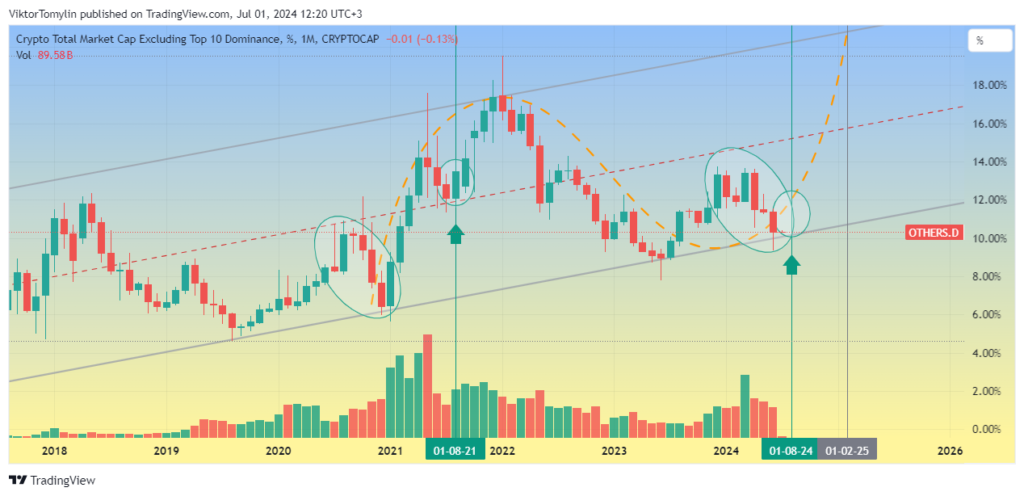
On the weekly chart, we see that most altcoins are behaving unchanged. The indicator shows data on altcoins outside the top 10 according to the CoinMarketCap service, such as Ethereum, BNB, Solana, XRP, Toncoin, Dogecoin, and Cardano. All other altcoins, of which there are more than 100, are also included in this indicator. If we look at the previous data, we can see that in 2021, there were four months of red candles before the start of a strong growth phase. Currently, we are seeing a similar situation with three months of red candles, which may indicate a future reversal.
Daily chart of altcoins
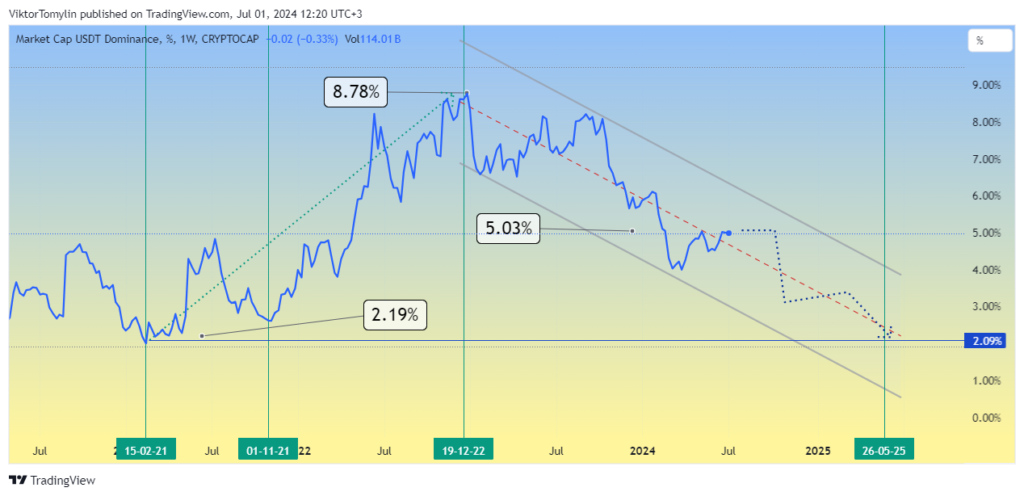
On the daily chart, we can see that the candles have changed from light to dark, which may indicate the beginning of a growth phase. The light candles have changed to dark ones and indicate a possible reversal this month or next month. The dominance of the USDT is also an important indicator. In 2021, it was around 2, then a divergent trend began and altcoins and bitcoin overflowed into USDT. At the beginning of 2023, there was a small spillover of USDT into bitcoin, indicating the potential future growth of altcoins.
USDT dominance
USDT dominance is important for understanding the overall market situation. It shows how much money is held in stablecoins ready to invest in cryptocurrencies. In 2021, the USDT dominance was minimal, after which an upward trend began, indicating a possible future overflow of funds from USDT to altcoins. At the moment, USDT’s dominance is in a trend corridor that may last until autumn, after which we can expect a sharp move in cryptocurrencies.

To sum up, we can say that altcoins are currently in the accumulation phase, and we expect a reversal in the near future. The dominance of USDT shows that funds are ready to invest in cryptocurrencies, and this may happen as early as autumn. It is important to follow the indicators and trends to enter the market in time and get the maximum profit.
I recommend following news and indicators to make informed investment decisions. Remember that this is not a financial recommendation, but only my personal opinion. I wish you success in crypto trading and investments! Don’t forget to donate to the Armed Forces and support our country in this important time.
*** Translated with www.DeepL.com/Translator (free version) ***


